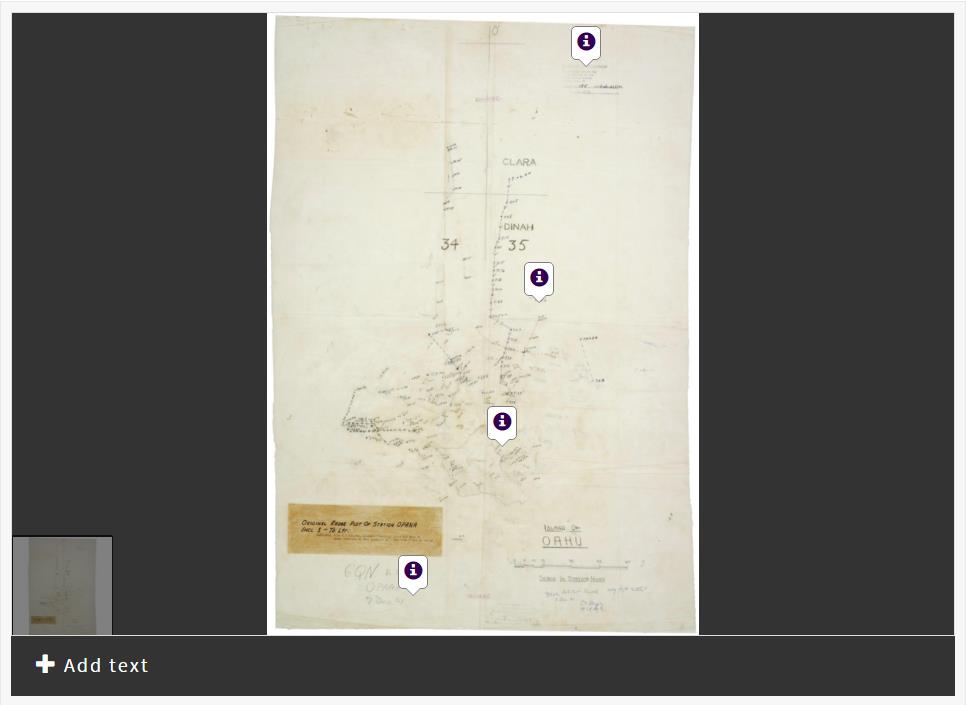
 See activities created with the Interpreting Data tool.
Introduce students to primary source documents that demonstrate the use of data as a means of communication or persuasion. Encourage them to analyze historical data and consider the source, presentation style, and intended impact of the material.
Learning Objectives
- Practice extracting historical information from data sources
- Hypothesize how data was collected, who created it, and the purpose in doing so
- Consider how presentation style influences interpretation of data
- Consider how research methods influence results
To Create an Interpreting Data Activity:
- Go to My Activities and create a new activity.
- Choose one or more documents to include. You can pull in all pages of a document, or only specific pages. Arrange the documents in the order you'd like students to see them in. Decide whether students will be able to access all of the details available for the document (including dates and descriptions), simply the document images and titles, or nothing beyond what they can see displayed in the activity.
- Embed questions, hints, or directions on the document for students to see using the Add Text feature. Decide whether to include the "Consider the Source" questions that ask students to think about the reason the document was created.
- Write instructions for your students, including an introduction and conclusion. You can include questions or a follow-up assignment in your conclusion. Students can email their responses to you if desired.
- Preview the student activity and create a snapshot.
- Lastly, describe your activity to other teachers by providing a summary. Tag it with the appropriate historical era, historical thinking skill, level of Bloom's Taxonomy, and grade level. You can also include detailed teaching instructions.
Teaching Tips
- Model document analysis with at least one document in the activity, or another example document, before asking students to begin the activity. Remind them to analyze the documents they will see carefully.
- Ask students to notice what makes a document unique: the title, the labels assigned to the data, timeframes and scale, dependant and independent variables, and the focus of the data. Help students place such information into historical context and then formulate historical conclusions based on what they’ve seen.
- Ask students to hypothesize about why a document may have been created before formally beginning the activity. The exercise can act as a pre-assessment and can help to guide students' thinking. Once students begin to examine the documents, they'll have a purpose and begin to contextualize them.
- Follow activities with class discussion about students' responses to contextualize the documents and student conclusions.
- Students can address a particular problem that you pose. When creating the activity for students, annotate the documents with text pins to point out significant clues that address your central question. Students work off of the hints or questions you pose to notice the most relevant parts of the document, then start to form conclusions based on the data. To demonstrate the basis for their interpretations, students can add their own text to point out significant data they find.
- Provoke students to think about the role of data in society, and when and why people choose to present information through numbers or statistics rather than through other means.
- Include the optional "Consider the Source" questions to prompt students to think about the source and intended audience:
- How do you think this data was collected?
- Who do you think created the document(s)?
- Why do you think the document(s) were created?
- What questions does this raise in your mind?
- In your conclusion, ask students to consider other possible means of conveying the same information. How could the audience have perceived the information differently or how their reaction to it might have been different based on the method of presentation?
- Students in early grades can develop graph and chart-reading skills through Interpreting Data. Activities can introduce primary sources to younger students and help them practice basic document analysis. Construct an activity with simple graphs, charts, or tables of data. Walk students through analysis of each document, providing them with hints as needed. Help them decipher what each particular document is, why someone would have made it, and how the audience likely received the information.
 See activities created with the Interpreting Data tool.Introduce students to primary source documents that demonstrate the use of data as a means of communication or persuasion. Encourage them to analyze historical data and consider the source, presentation style, and intended impact of the material.


