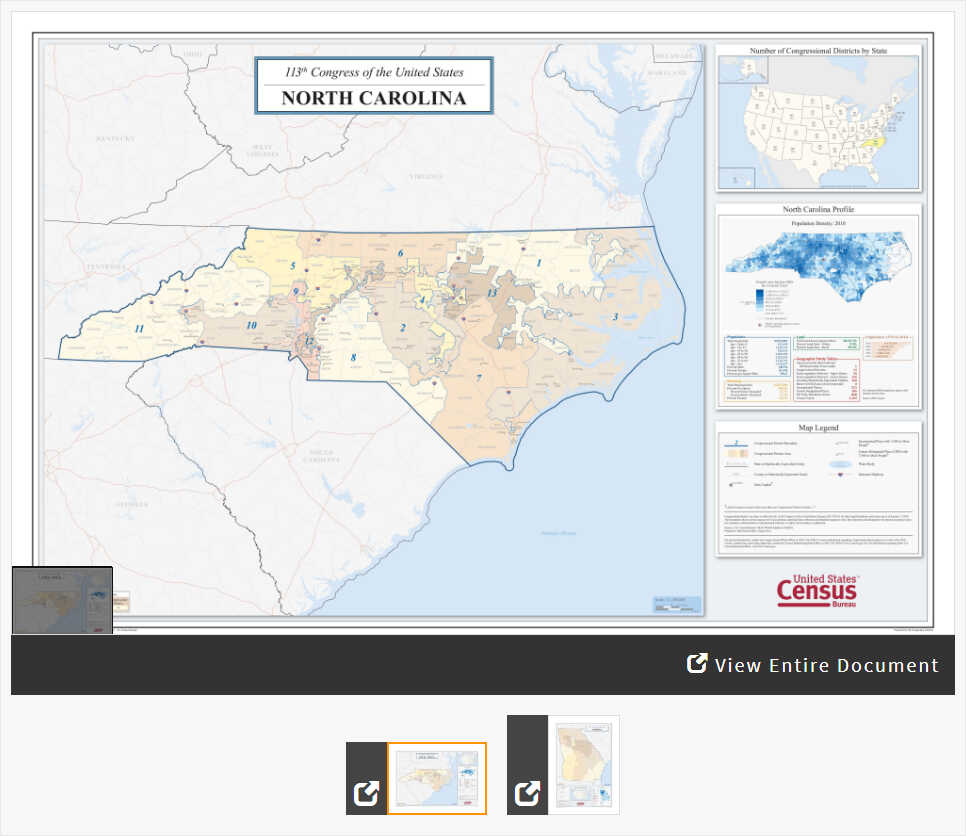
In this short comparative analysis activity, students will compare and contrast the congressional districts of North Carolina and Georgia following the redistricting that occurred after the 2010 Census. Students will explore these maps to understand the extent of "gerrymandering" that can occur in congressional representation.
Suggested Teaching Instructions
This activity is intended as a warm-up or introduction to a unit on congressional representation, civics, or gerrymandering. For grades 6-12. Approximate time needed is 20 minutes.
Explain to students that since 1929, the House of Representatives has been fixed at 435 members (when the Permanent Apportionment Act set this as the maximum number of representatives). Every 10 years, following the results of decennial Census, the number of House members representing each state is subject to change. When this occurs, either the state legislature, an independent commission, or another group draw up new districts to accommodate the additional seats in Congress. Even within states that did not gain or lose representation, changing population trends within the state lead to newly shaped Congressional districts as each congressional district must have roughly the same population within a state.
Explain to students the idea of "gerrymandering" and its origin in the early 1800s. Explain that when political parties (typically through state legislatures) are directly in charge of redrawing districts, they often try to give their party an advantage. They can do this by "cracking" – distributing the other political party's voters into multiple districts which dilutes their voting power, or by "packing" – concentrating the other party's voters in one district, thus reducing their voting power in other districts.
Instruct students to begin the activity, individually or in pairs, by looking at the Georgia and North Carolina State Congressional District maps. Model document analysis. Zoom in and around the congressional district maps, noting details like cities, counties, and other geographic features.
Direct students' attention to the Congressional districts surrounding their capital cities and other major metropolitan areas. For example:
- Charlotte, NC (North Carolina's 9th Congressional District)
- Raleigh, NC (North Carolina's 4th Congressional District)
- Greensboro, NC (North Carolina's 6th Congressional District)
- Durham, NC (North Carolina's 1st Congressional District)
- Winston-Salem, NC (North Carolina's 12th Congressional District)
- Atlanta, GA (Georgia's 5th Congressional District)
- Augusta, GA (Georgia's 12th Congressional District)
- Columbus, GA (Georgia's 2nd Congressional District)
- Macon, GA (Georgia's 2nd Congressional District)
- Savannah, GA (Georgia's 1st Congressional District)
Invite students to share their opinion about the shape of the districts in Georgia and North Carolina. Ask them to explain why certain districts were drawn in those particular shapes.
Direct students to the "When You're Done" section. Begin a discussion based on the following questions:
- How do you think Congressional districts should be drawn?
- Which state do you think created more appropriate Congressional districts? Why?
It may be helpful to share the following with students:
In both Georgia and North Carolina, the congressional district lines were drawn by the state legislatures. The only difference being that in Georgia, redistricting plans were subject to veto by the governor. Both states were required to get federal approval, called "preclearance," per the Voting Rights Act of 1965 to prohibit racial discrimination. (The 2013 Supreme Court decision in Shelby County v. Holder removed preclearance requirements.)


