Analyzing a Map with Data
Focusing on Details: Zoom/Crop
All documents and text associated with this activity are printed below, followed by a worksheet for student responses.Introduction
Look at the historical map below. You are seeing only a small portion of this map to start with.- What do you see?
- What do you think it is about?
- What place or places are shown?
- What do you think the words represent?
- What do you think the numbers represent?
- What do you notice about the changing shades of gray? How does it relate to the numbers?
Once you've answered these questions, click on "Switch View" to see more of the map.
Name:
Class:
Class:
Worksheet
Analyzing a Map with Data
Focusing on Details: Zoom/Crop
Examine the documents included in this activity and write your response in the space provided.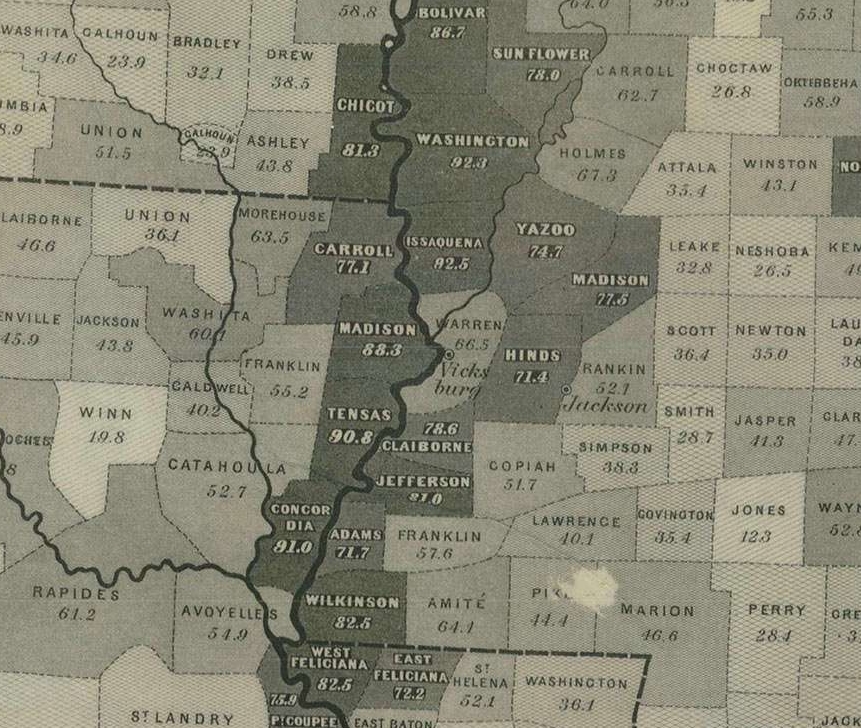
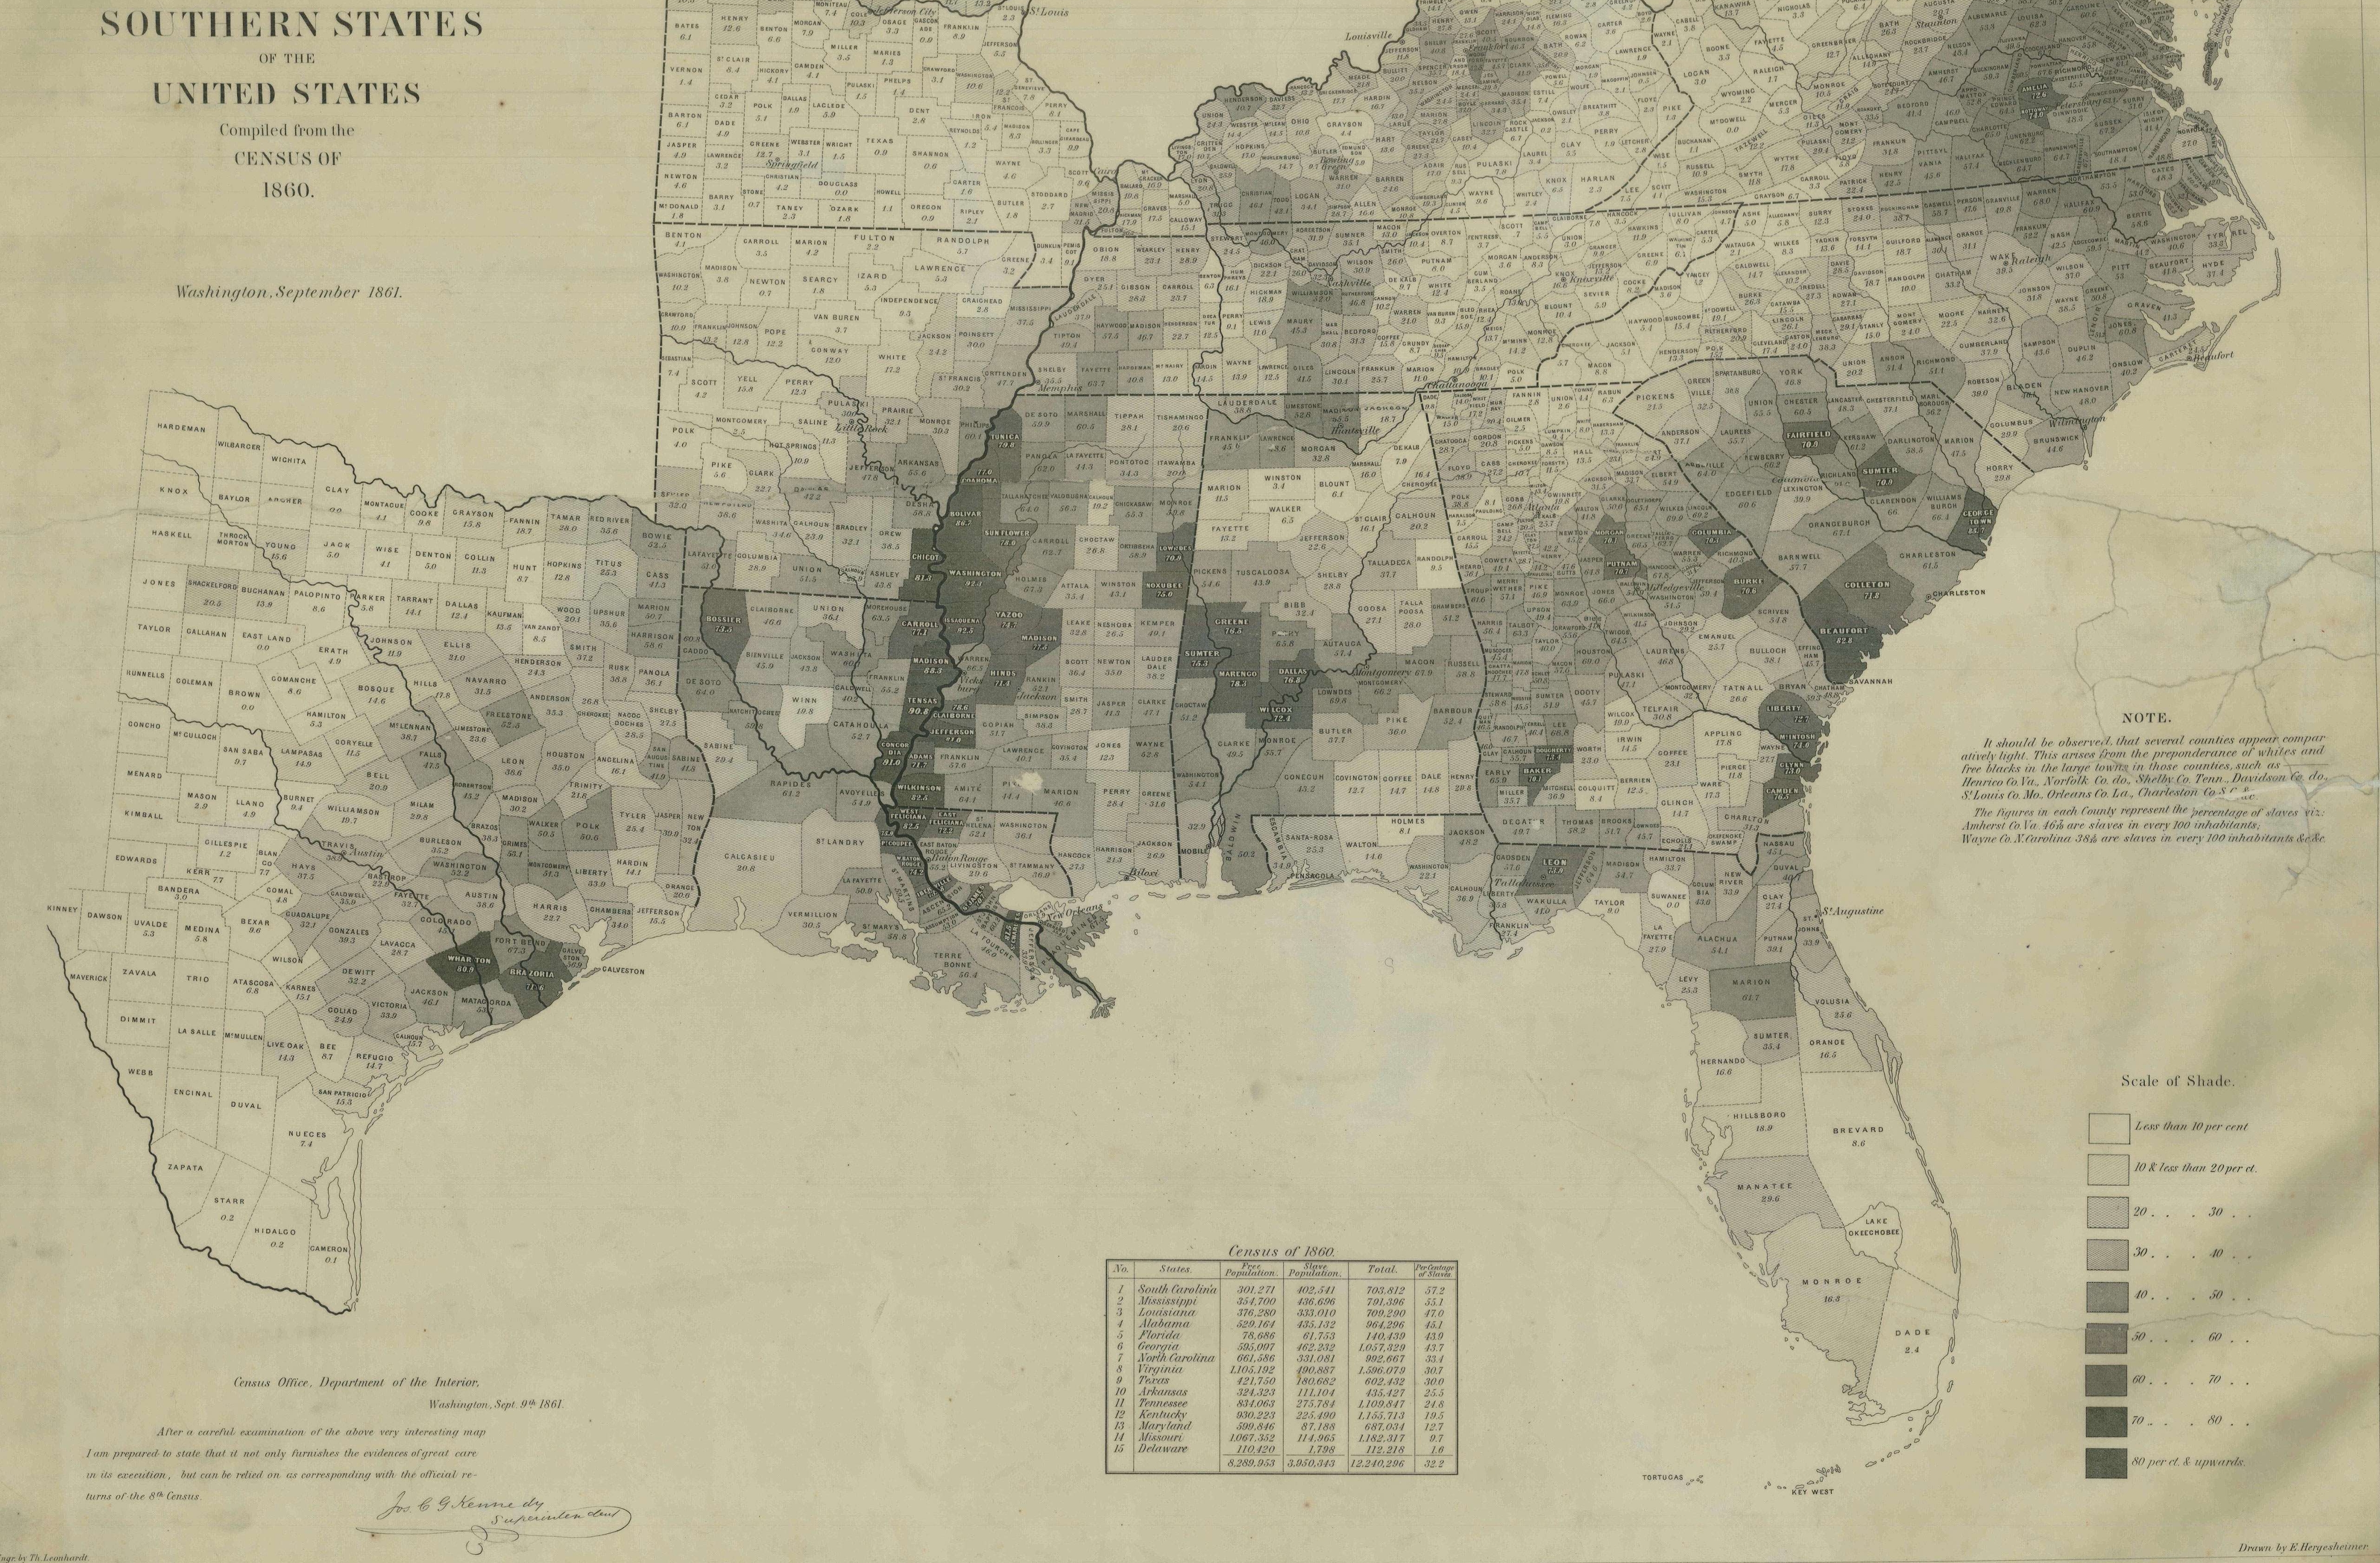
You now see a larger portion of a historical map.
- What do you see now?
- What place or places are shown?
- What do you think it is the purpose of this map?
Your Response
1
Activity Element
Map Showing the Distribution of the Slave Population of the Southern States of the United States
Page 1
2
Activity Element
Map Showing the Distribution of the Slave Population of the Southern States of the United States
Page 1
Conclusion
Analyzing a Map with Data
Focusing on Details: Zoom/Crop
After clicking on "View Entire Document," discuss the following.- What does this map tell you about the distribution of enslaved people in the United States prior to the Civil War?
- What areas have a higher percentage of enslaved people?
- What areas have a lower percentage of enslaved people?